

When it comes to making a business strategy, using a six sigma process mapping will be very effective to help you figure out your whole process before you get started. This will help you plan everything out beforehand so that you can create the quickest and most effective plan.
Six sigma process mapping is the technique used to help visualize the steps involved in a certain process or activity. Typically, this is done by creating a flow map that illustrates all the inputs and outputs that may take place during the process in an easy-to-read format.
But, now that you know what process mapping is, what is six sigma and how do you actually create a process map. I will continue to answer these questions along with giving extra information about process maps like the different types and how they are made, and the benefits that process mapping provides.
What is Six Sigma
While process mapping in six sigma is a business concept used to visualize the whole plan of a process or activity, six sigma itself is a statistical process that analyzes data in order to analyze and reduce errors or defects.
Since it has been created, six sigma has been used to reduce the amount of manufacturing process, and they have helped by getting the amount of manufacturing down to 3.4 per every million units or events produced.
Six sigma is also a method that is offered to businesses that offer organizational tools to help companies and businesses improve their capabilities to manage their business. “This increase in performance and decreasing process variation, it is possible to reduce defect rates, improve employee morale, and improve the quality of products or services, which all contribute to a higher level of profitability.”
Six sigma itself is a complex topic and to fully understand it you will need to read an article dedicated to just six sigma. However, to put it simply, it is a process that uses statistics to attempt to get products 99.99966% free of defects in their products.
What is the Purpose of Six Sigma Process Mapping
The purpose of a process map is to work together to create a common understanding of the process and how it should work.
When putting together key factors to consider when creating your flow map is to identify steps of the process that add complexity and need to be simplified, visually compare the current process to the potential new process, and make it easier for those outside the project team to understand the process.
In addition, Six Sigma process maps can be implemented at the beginning of a project or in the middle of an existing process to improve outcomes.

What are the 5 Common Types of Process Maps
There are 5 common process maps types:
- SIPOC
- Swim lane
- High level
- Detailed
- Value stream
Let’s take a closer look at each type.
SIPOC Maps
The first of the common types of process charts is the simple SIPOC map. This stands for suppliers, inputs, process, outcomes, and customers.
The main feature of this map is that it gives you a high-level overview of your process and its contributing components.
This is typically used while you are in the earlier stages of process mapping and typically is changed into another form of a more detailed map later in the development process.
Swim Lane Maps
The next type of map is a swim lane diagram or deployment flowchart. So how this map works is by dividing the process by the person or team who is in charge of that stage.
Along with showing the cross-functionality of your team, with swim lane maps you are able to see exactly where handoffs take place.
This can be highly beneficial as it is during these handoffs that you are most likely to have errors occur, so while seeing these handoffs you can help reduce errors.
The swim lane map is also the only one of the process maps that shows when and where handoffs occur out of the 5 charts.

High-Level Maps
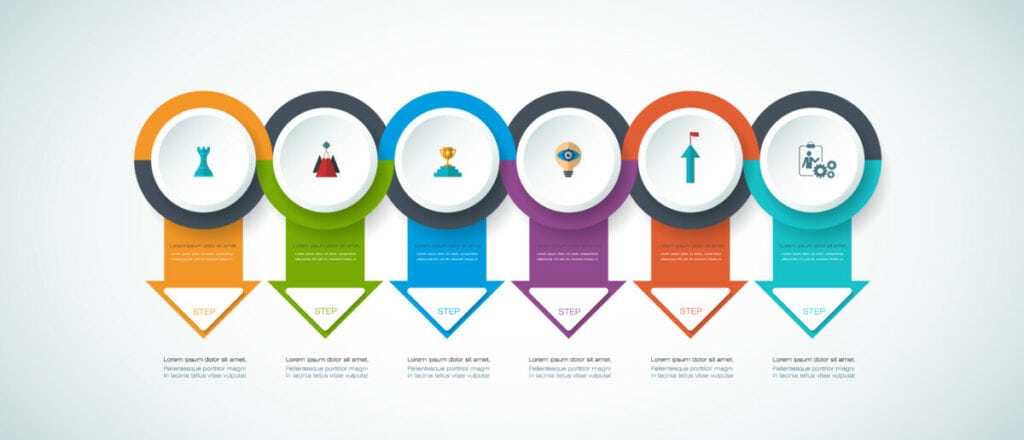
The high-level process map is one of the simpler maps that allows you to quickly and easily see the steps in the plan.
This is one of the most simplistic maps as it doesn’t show too many details, but rather just the most basic steps.
While you will want to have other versions of this map that include more details, this map is valuable when working with executives or managers, since they often need to see what’s going on but don’t always need all the specifics involved in a process.

Detailed Maps
As its name would suggest, the detailed map is one of the most detailed maps. This is usually the fully fleshed-out and detailed version of the high-level maps and shows all the details that are included throughout the plan.
Because it requires so much detail, this process map is especially important for finding the root cause of errors or waste in a process.
You may also need to involve the employees who perform the process since they will have the most knowledge about it.
These maps can have repeating steps that are taken over and over again until you are happy with the results and can have a wide variety of steps or processes factored in.

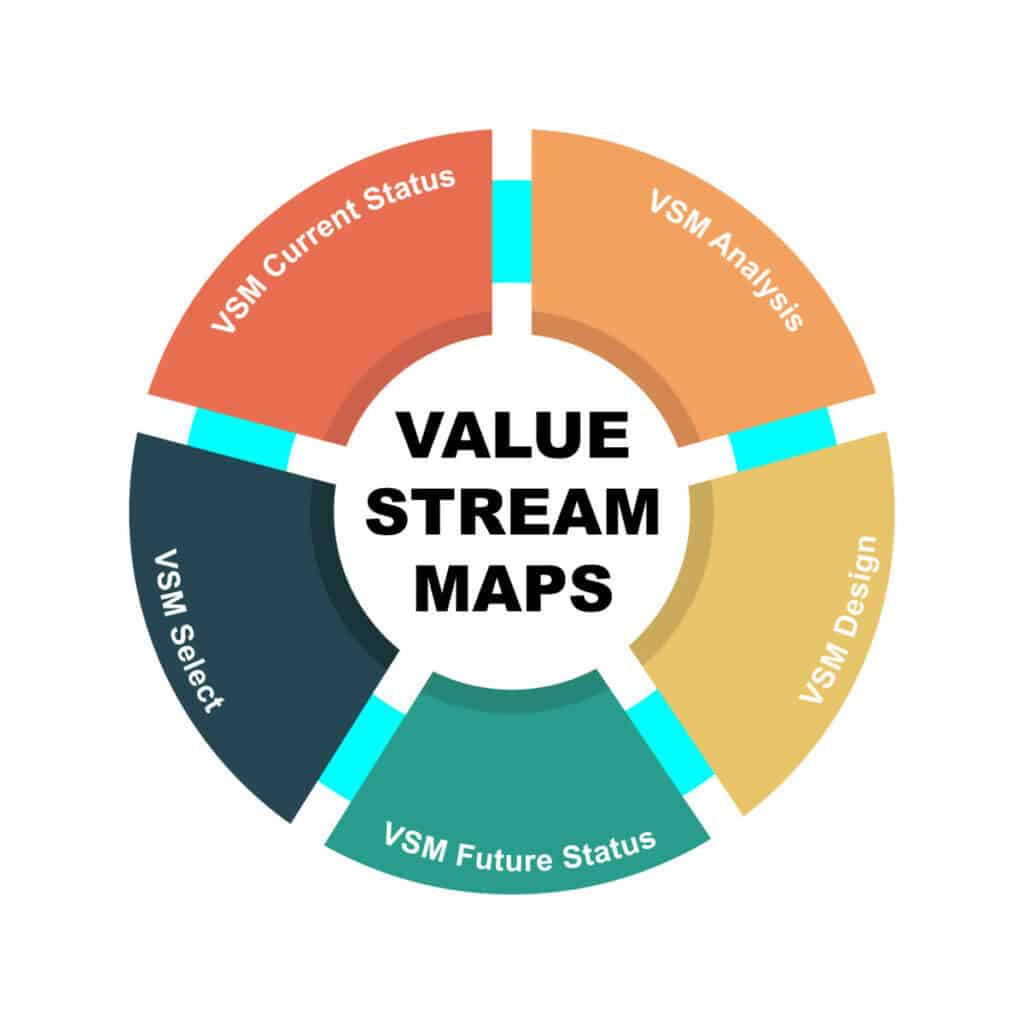
Value Stream Maps
Value stream maps are the last and likely the most complex type of the common six sigma process maps.
This is part Lean implementation process illustration and also part value stream map and is a process map that illustrates and analyzes the steps involved in producing a product or delivering a service.
It’s a detailed diagram that displays a process’s current state, focusing on valuable or non-value added activities in the process.
The Benefits of Process Mapping
One of the biggest benefits of process mapping is that you get to see the whole process before you even get started. By getting to visualize the entire work process before you begin, you will be able to streamline your process.
Rather than walking through the process as you go, you can visualize concepts and grasp ideas faster. This will also help you identify any mistakes that may occur during the whole process.
By visualizing the whole process, you also get to see if there is anywhere that creates waste in material, work, or time. This map will help you pinpoint these areas and fix your process to make it most effective and efficient. It shows who does what, when, and where.
Then you can follow up with the question “why?” You can propose a hypothesis and test it. In this case “Could we reduce 5 steps to 2?”
Along with being able to see any pitfalls or areas of waste within the plan, process mapping lets you better deliver on expected results.
“Six Sigma process mapping forces you to see your process as it really happens so you can see where you may fall short of those expectations.”
This will allow you to be able to eliminate any defects so that any customers will be able to receive the expected product when they expect to receive it.
One of the last major benefits that process mapping provides is just how useful old plans and maps can be for future planning and training purposes.
After you create your first process map, no matter what type of map it is, you can use it for future reference when you have to make another plan. It can also be used for training purposes in the fact that when you are teaching this process to new employees, they can better visualize what process mapping is and how it works.
How Does Process Mapping in Six Sigma Help in Getting the Narrative Right?
Process mapping in Six Sigma is crucial for crafting a compelling narrative. It helps organizations identify inefficiencies and streamline operations. By visually outlining each step of a process, organizations can better understand the flow and make necessary improvements to ensure a smooth and impactful narrative.
How to Start Process Mapping
1. Select the Process
The first step when it comes to creating a six sigma process map is to identify the reason for creating the process map.
Is there something in the process not meeting its mark? Or is your business/company planning a new service? Or is it that the goal is to augment the value derived from the process?
Next, you will want to identify the beginning of the process. These will be the events that create the demand for the process map and trigger behind the process.
Then, you will need to find the end step as well. This end step will need to be uniquely defined and must state what parameters or conditions will finally satisfy the demand.
2. Identify the Slope
Next, the manager will need to observe the entire process and collect all the important and relevant information and data. The observed process and collected data must then be properly documented.
It is essential to identify all the parameters that are involved in the process like the machinery, suppliers, etc.
It is also vital to identify and verify the inputs involved and outputs of the process.
3. Plan and Schedule
Next, you will need to identify all the systems that are involved in the process. One of the key factors for managers when it comes to creating process maps is to shift from a function-oriented mindset to a process-oriented mindset.
Designing the process map can only be done by focusing on the roles and not the jobs. Based on the systems and roles, proper scheduling of the people involved, the task involved, and the estimated time needs to be done.
4. Select Mapping Technique
You will then want to determine what mapping type you will want to use, or, depending on the circumstance, which maps and in which order you are going to make them.
Next would be to plan the process of interviews with individuals as well as focused groups. It is also advised to review any previously documented process maps to understand previous mapping efforts, organizational charts, and job descriptions.
5. Conduct Interviews
Now you will get to conduct interviews with people!
Plan and conduct the interviews in the sequence of roles established in the process map. Explain the purpose, objective, and scope of the interviews as well as the process maps to the participants in order to reap effective results.
When you are conducting the interviews, it will be important to establish the input tasks, roles, output tasks, decisions, tasks performed, and linkage to other processes.
While doing this task, you will want to make sure that every task and decision within the process map has been identified.
6. As-Is Process
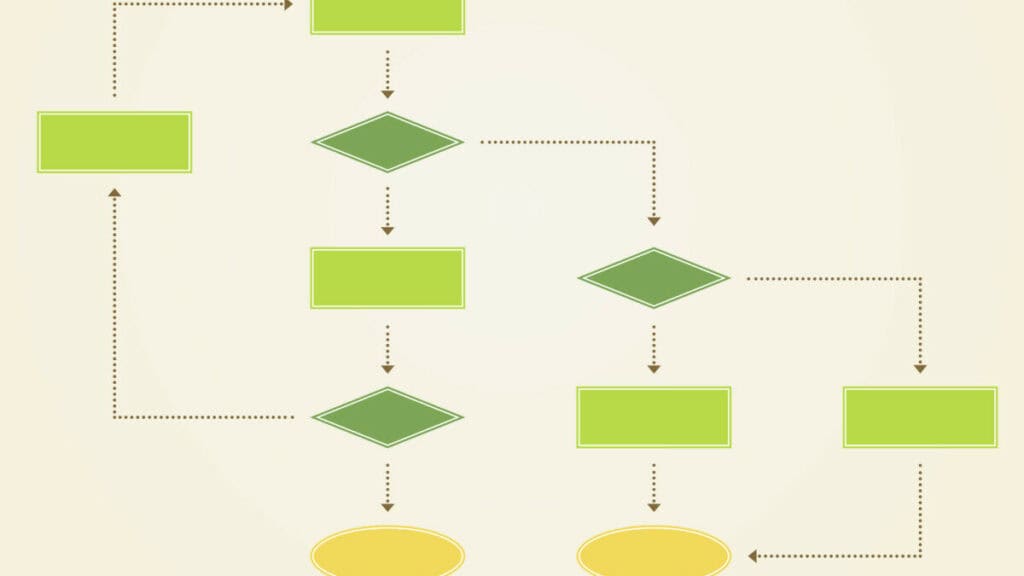
It is time to map the actual process without considering the ideal “should be process” or as per “standard operating procedures (SOP).” Carefully list and match all the steps of the process with their respective roles. Assign correct flowchart symbols and review the process map for proper flow.
- Terminator: Both the start and end of the process
- Rectangle: A step or task that must be performed as part of the process
- Oval: The inputs and outputs of a step or the entire process (commonly found at the beginning and end of the process)
- D: “D” symbols indicate delays in the process
- Arrow: Movement in the process—an indication of where the process flows from step to step
- Diamond: A point in the process where a decision must be made

Some of the points that need to be considered are the major activities of the process, decisions, and source of approvals of one step before moving to the next one, areas where multiple methods occur, causes of bottlenecks, extra work, and waste and factors that obstruct process members from performing effectively and efficiently.
7. Analyze and Evaluate Results
Lastly, you will want to review the whole process thoroughly in order to find any areas of waste, redundancies, unneeded steps, bottlenecks, or any other steps in your plan that slow it down or creates problems, and rework the plan to improve those.
Next, you will want to start implementing your plan and after a short time evaluate how effective it is. One can make use of the tools to measure the same using Pareto Charts, Cause and Effect diagram, process behavior charts, and process modeling and simulation.
Then, finally, you will want to make any improvement to your plan in order to make it most effective and remove anything that is slowing your process or causing waste.