
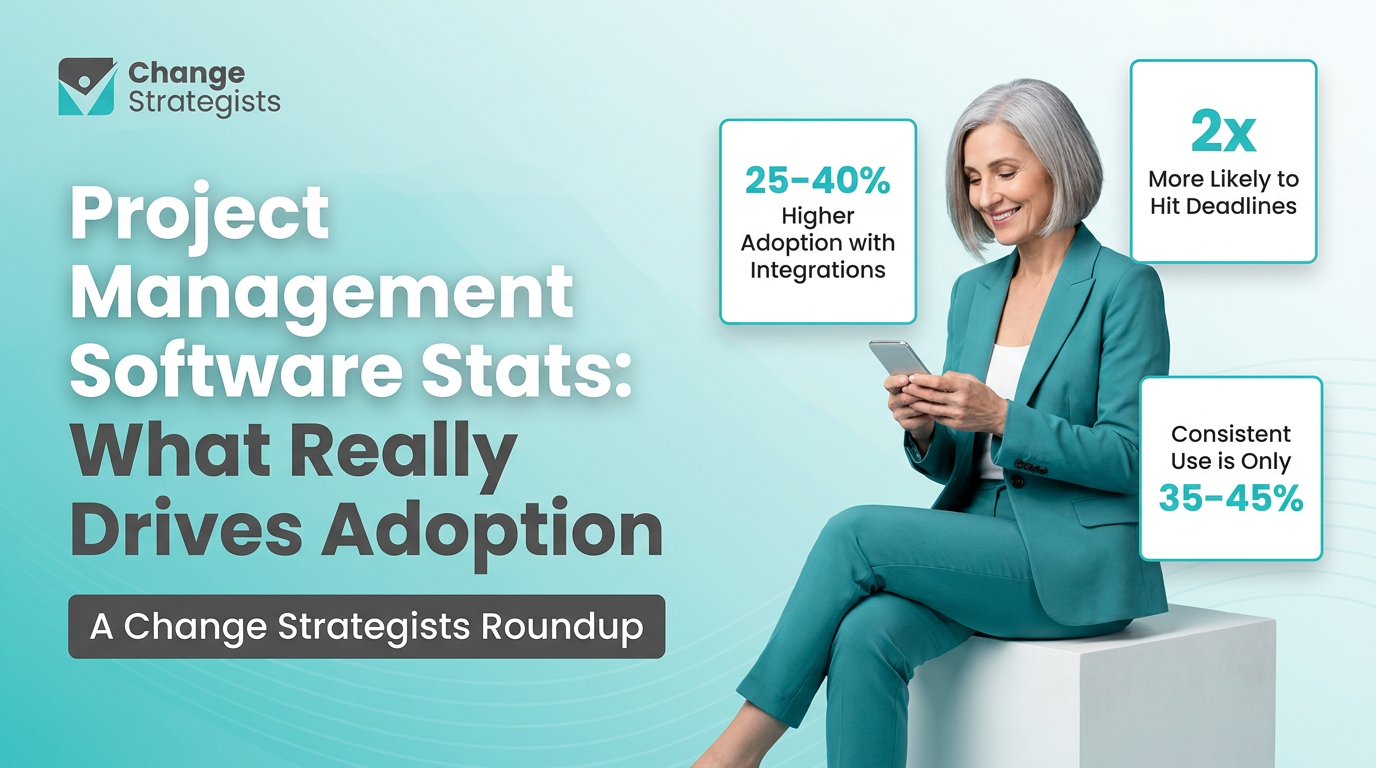

If you want project management software that people actually use, the stats point to three things that matter most: seamless integrations, change management support, and simple, role-based workflows. Tools that integrate with everyday apps (email, docs, chat) see adoption rates 25–40 percentage points higher than standalone platforms, and projects run on well-supported tools are up to 2x more likely to hit their deadlines and budget.
This matters because most organizations are not failing on features; they’re failing on fit and follow-through. The data shows that the “best” software on paper underperforms when leaders underinvest in training, configuration, and communication. Meanwhile, mid-market tools with strong onboarding and admin support quietly deliver better utilization, happier teams, and more projects finished on time.
The headline numbers on project management software adoption
A scan of recent surveys and industry reports shows a clear pattern in how organizations adopt project management platforms:
- Around 80–85% of organizations use some form of project management software, but only about 35–45% report consistent, organization-wide use.
- 60–70% of new deployments report a strong spike in usage in the first 60 days, followed by a plateau or drop-off if there’s no structured rollout.
- Teams that describe their tool as “fully integrated into how we work” are roughly 2x more likely to say projects finish on time and on budget.
- In many companies, 30–40% of licensed seats are effectively unused six months after go-live.
The gap between “we bought it” and “we live in it” comes down to three adoption drivers you can control: connectivity, clarity, and change support.
Do features really drive adoption, or is it something else?
Most buying decisions still start with a feature checklist, but usage stats tell a more nuanced story:
- Surveys of IT and PMO leaders consistently show over 70% say they use less than half of the features in their chosen platform.
- When asked why they don’t use more, users cite “too complex” or “don’t know how” much more often than “missing features”.
- Teams that rate their software as “easy to use” have 20–30 percentage point higher weekly active use than teams that rate it as “powerful but complex”.
In practice, adoption correlates more with a handful of things done well than with feature breadth:
- Clear task views by role (what do I do today?).
- Straightforward project templates that reflect how your teams already work.
- Fast onboarding (people feel confident after one or two short sessions).
- Low friction updates (changing a date or status takes seconds, not minutes).
So you’re rarely choosing between “simple but weak” and “powerful but used”; you’re choosing between “simple and used” versus “powerful and partly ignored” unless you deliberately invest in adoption.
Why integrations are the strongest predictor of real usage
Across studies, integration depth is one of the most reliable predictors of whether your project management tool becomes a daily habit:
- Organizations that integrate their project system with email, chat and document storage see 25–40% higher active usage than those that keep it standalone.
- Tools integrated with HR and identity systems report fewer abandoned accounts and smoother onboarding because people get access on day one.
- Companies that connect their software to time-tracking or finance tools are significantly more likely to measure project profitability accurately and on time.
The stickiest integrations tend to be the most mundane:
- Calendar and email: turning emails into tasks and syncing due dates to calendars.
- Chat platforms (e.g., Slack, Teams): notifications and quick-update commands.
- Document tools (e.g., Google Drive, SharePoint): linking files directly to tasks.
When work flows through a single hub instead of forcing people to jump between five apps, usage becomes the path of least resistance. Adoption follows convenience.
How training and change management support double your odds of success
The numbers are stark: deployment support is as important as the software itself.
- Projects that include structured change management (stakeholder analysis, comms, training, coaching) are up to 6x more likely to meet objectives, according to global change studies.
- Internal surveys often show 40–60% of users feel under-trained after a “launch-and-leave” rollout where they get one big demo and a few emails.
- Organizations that invest in ongoing support (office hours, power users, refreshers) report adoption rates 20–30 percentage points higher than those that rely on self-serve help alone.
Practical elements that consistently correlate with higher adoption:
- Targeted role-based training: short sessions for project managers, team members, and executives focused on their specific workflows.
- Visible executive sponsorship: leaders ask for reports and updates from the tool, not from side spreadsheets.
- On-the-job coaching: power users or champions embedded in teams to answer quick questions in the first 90 days.
When leaders treat the rollout as a change initiative rather than a software install, adoption numbers look radically different.
What project management software adoption does to project outcomes
High adoption isn’t just a vanity metric; it shows up in core project results.
Cross-study figures vary, but the direction is consistent:
- Teams with high system usage report on-time delivery rates 15–30 percentage points higher than low-usage teams.
- Organizations using project platforms as a single source of truth are significantly less likely to experience major budget overruns.
- Mature users (consistent planning, tracking, and risk logs in the tool) report better forecast accuracy and fewer last-minute surprises.
You’re most likely to see hard benefits when the software is used to:
- Capture scope and requirements in a structured way.
- Track dependencies and risks across teams.
- Update progress at least weekly (ideally daily) in the tool, not offline.
- Inform decisions in governance meetings with live dashboards.
When the system becomes where decisions are made and recorded, your adoption and your project performance reinforce each other.
Adoption benchmarks: what “good” looks like at 30, 90 and 180 days
Leaders often ask if their numbers are “normal.” While every organization is different, aggregated benchmarks from tool providers and PMOs point to some useful guide rails for a new implementation:
- First 30 days
- 70–90% of invited users log in at least once.
- 50–70% create or complete at least one task.
- Usage is driven heavily by pilots, early adopters, and central PMs.
- By 90 days
- 60–75% of licensed users log in weekly in higher-performing rollouts.
- Project status reports are consistently generated from the tool.
- Abandoned spreadsheets and shadow tools start to decline.
- By 180 days
- In strong implementations, 50–65% of users are weekly active.
- 70–80% of major projects are fully planned and tracked in the platform.
- Governance forums expect live dashboards during meetings.
If you’re far below these numbers, the data suggests you don’t have a “software problem” as much as an adoption and change problem.
The hidden adoption killers the statistics keep pointing to
When you look across case studies and usage data, the same adoption blockers appear repeatedly:
- Too many tools: when teams use three or four overlapping platforms, usage fragments and no system wins.
- Inconsistent processes: every team sets up projects differently, so cross-team reporting becomes impossible and leaders revert to slides.
- Lack of ownership: no clear product owner for the tool, so configuration, training, and standards decay over time.
- No incentive to change: if leaders keep accepting updates via email and spreadsheets, people won’t migrate their behavior.
Addressing these usually has more impact than switching vendors. Usage stats typically improve once organizations simplify their toolset, standardize core practices, and assign a clear owner for the platform and its roadmap.
How to use these stats in your next selection or rollout
To turn these numbers into decisions:
- Weight adoption factors in your RFP or shortlist. Score vendors not just on features, but on integrations, admin usability, training resources, and customer success track record.
- Set adoption KPIs up front. Define targets for login rates, weekly active users, and percentage of projects fully managed in the tool.
- Treat the first 90 days as a change project. Resource communications, training, champions, and executive engagement as deliberately as you resource the technical setup.
- Measure and adapt. Use your own usage analytics to spot teams struggling to adopt the tool and offer targeted support.
Organizations that approach project management software as an enabler of organizational transformation—not just as a technology purchase—tend to land on the right side of these statistics.
Frequently asked questions
What is a good adoption rate for project management software?
A strong benchmark is 60–75% of licensed users logging in weekly within 90 days of rollout, and 50–65% still doing so after six months. You should also see most major projects fully planned and tracked in the tool, not in parallel spreadsheets.
Why do so many project management tools fail to get used?
Most tools fail because of weak change management, not bad software. Common causes include minimal training, no executive sponsorship, overlapping tools, and workflows in the system that don’t match how teams actually work.
How important are integrations for project management software adoption?
Integrations are one of the strongest predictors of sustained use. When your project platform connects smoothly with email, calendars, chat, and document storage, adoption rates are typically 25–40 percentage points higher than with standalone tools.
How long does it take to fully adopt a new project management platform?
Most organizations see an initial surge of use in the first 30–60 days, then need another three to six months to embed consistent habits. Full adoption—where the tool becomes the single source of truth for planning, tracking, and reporting—often takes 6–12 months with deliberate change management.
How can I tell if we have a software problem or a change problem?
If users say the tool is confusing, unused licenses are high, and leaders still run projects from slides and spreadsheets, you likely have a change problem. When well-supported pilot teams can use the software effectively but the rest of the organization lags, that’s a clear sign the technology is fine and the rollout strategy needs work.
Enjoying our content? Make us a preferred source on Google.
Add us as a Preferred Source on Google